Household displacement after disasters
Overview
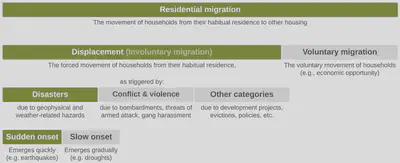
Over 265 million people were displaced due to disasters between 2008 and 20181. In the forthcoming years, the annual number displaced is expected to increase, driven by poorly-managed urban growth in hazard-prone areas2 and potentially exacerbated by climate change3. Despite this scale of human impact, most disaster risk assessments focus on direct economic losses, a metric that often highlights the wealthiest as the most at-risk. However, the reality of disasters is that the poor are disproportionately affected4, and mitigations informed primarily by economic loss may deepen existing inequalities. This research proposes to quantify disaster-induced displacement; a more equitable risk metric to depict the human toll of disasters.
Research themes
The importance of duration
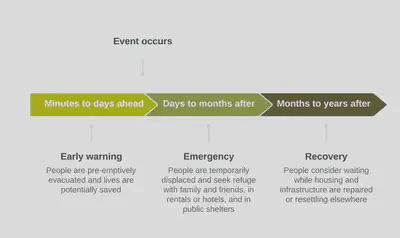
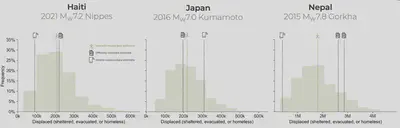
Most statistics regarding population displacement following a disaster event provide single snapshot values, often representing a peak estimate during the emergency phase. However, the duration of displacement is essential for understanding the human impact. For example, large- scale displacement in the form of evacuations before a storm can save lives and be followed by mass return shortly afterward. In contrast, a devastating event such as an earthquake could damage or destroy a significant proportion of the residential building stock, causing occupants to seek alternative accommodations for months to years. Not only does this type of protracted displacement pose a significant disruption to the livelihoods of affected households (e.g., lost income, interrupted education), but the consequences can ripple out into the larger community (e.g., outmigration and urban blight, lost economic production). Therefore, a key objective of this research is to refine our understanding of household displacement duration in disasters.
Determinants of household return
Disasters are life events that can subject households to key decision points, such as: whether to evacuate, where to seek shelter, whether to return/wait/relocate, and whether to stay or resettle. From a literature review of household return after disasters, the following categories of determinants have been identified.
| Category | Determinants of return | |
|---|---|---|
| Physical damage to the built environment |
| |
| Psychological & social phenomena |
| |
| Household demographics |
| |
| Pre- and post-disaster policies |
|
The role of housing damage
Disaster literature offers a clear consensus that housing damage is a primary driver of household displacement of disasters, both for initial displacement and longer-term displacement. However, additional factors (e.g., place attachment and housing tenure) have more recently been proposed as highly influential for household return in the recovery phase. Despite the range of factors beyond damage that have been proposed to influence household return, standard practice in disaster risk analysis is to solely consider housing damage. That is, the number of destroyed homes is multiplied by the average household size to yield an estimate of the displaced population.

I benchmarked predictions of household displacement based solely on housing damage to understand the extent to which such simplified models can explain the phenomenon. The scenario model estimates showed some promise to predict potential long-term housing needs. However, quantifying displacement duration remained a clear challenge as official reports lacked this information and model estimates similarly lacked a time component. Mobile location data could theoretically fill the data gap on duration, but the benchmarking results indicate that further investigation is required on such data-driven methods.
The full results of the benchmarking study are available in a journal paper and a conference paper.
Understanding protracted displacement
Available statistics on disaster displacement seldom distinguish between the short-term evacuations that save lives and the prolonged, severe forms of displacement that uproot them. To address this gap, I assemble and analyze new quantitative evidence on household displacement and return in disasters. Using both inferential and predictive modeling, I show how physical, socioeconomic, and psychological factors interact to drive displacement durations across three geographic scales: local, national, and global.
| Study | Hazard type(s) | Geographic extent | Event period |
|---|---|---|---|
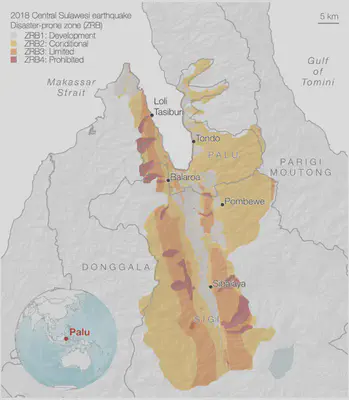
| Central Sulawesi, Indonesia | Earthquake, tsunami, liquefaction | Local | Single event |
| United States | Hurricanes, floods, wildfires, … | National | About 3 years |
| Global | Earthquakes | Global | Over 10 years |
Housing destruction is a consistent primary driver of protracted displacement and provides a reasonable first-order approximation of potential long-term housing needs. However, this metric alone cannot identify who will experience the most prolonged displacement or when households are likely to return. Socioeconomic factors (e.g., income, inequality) emerge as critical secondary drivers, whereas psychological factors (e.g., place identity) are more locally relevant and contextual. By incorporating these models into disaster risk assessments, policymakers and practitioners can better understand the human toll of disasters and design interventions that reduce the most adverse forms of disaster displacement.
After the 2018 Central Sulawesi multi-hazard event in Indonesia
Coming soon! A paper documenting our household surveys and descriptive analyses is available by open access. A second manuscript that conducts formal analyses and summarizes policy implications is in review.
Across three years of natural hazards in the United States
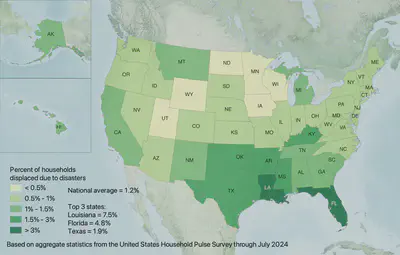
According to new data from the United States Household Pulse Survey (HPS), approximtely 1.1% of households have reported being displaced in recent disasters. However, the rates of disaster displacement vary widely state-by-state.
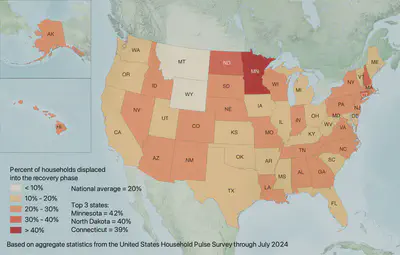
The vast majority of displaced households returned quickly: 43% within a week and an additional 23% within a month. However, others faced more protracted displacement: 20% took longer than one month to return and 14% had not returned by the time of the survey.
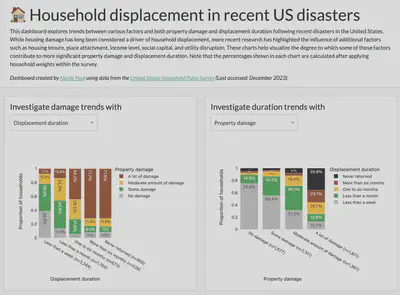
The availability of microdata from the HPS allows us to explore trends between displacement duration and return outcomes with potentially relevant factors such as: property damage, lifeline disruption, household demographics, and area-based attributes. To explore these trends, please refer to my interactive dashboard.
With the microdata, we can additionally fit predictive models and evaluate their performance. In our study, we propose three alternate models, which range in complexity and predictive power:
TreeP: A classification tree model that predicts return outcomes with a minimum number of predictors related to physical factors.
TreeP&S: A classification tree model that predicts return outcomes with a minimum number of predictors related to physical and socioeconomic factors.
ForestP&S: A random forest model that predicts return outcomes considering all predictions related to physical and socioeconomic factors.
The ForestP&S model additionally allows us to highlight the importance of different physical and socioeconomic factors to predictions of displacement duration and return. These model explanations confirm that property damage is a primary driver of displacement outcomes. However, they also indicate that some socioeconomic factors are critical to consider, such as a household’s tenure status and income level. Additionally, some factors (e.g., physical immobility, household sizes of 8+, educational attainment levels of less than high school) were associated with more negative outcomes.
Over a decade of earthquakes globally
Coming soon! A manuscript has been submitted and is in review.
Acknowledgments
This research is partly funded by the University College London Overseas Research Scholarship (ORS) and the Willis Towers Watson Research Network.
IDMC. 2019. “Disaster Displacement - A Global Review, 2008-2018.” https://www.internal-displacement.org/publications/disaster-displacement-a-global-review. ↩︎
IDMC. 2017. “Global Disaster Displacement Risk - A Baseline for Future Work.” https://www.internal-displacement.org/publications/global-disaster-displacement-risk-a-baseline-for-future-work. ↩︎
IPCC, ed. 2012. “Summary for Policymakers.” In Managing the Risks of Extreme Events and Disasters to Advance Climate Change Adaptation, 1st ed. Cambridge University Press. https://doi.org/10.1017/CBO9781139177245. ↩︎
Hallegatte, Stéphane, Adrien Vogt-Schilb, Julie Rozenberg, Mook Bangalore, and Chloé Beaudet. 2020. “From Poverty to Disaster and Back: A Review of the Literature.” Economics of Disasters and Climate Change 4 (1): 223–47. https://doi.org/10.1007/s41885-020-00060-5. ↩︎
Nicole Paul
ETH Fellow
Exploring how disaster risk models can inform shelter and housing assistance decisions in earthquakes, tropical cyclones, and floods